
More detailed information on ViWA
The Project Logic of VIWA
92-99% of the use of green and blue water accounts for agriculture. With a share of about 69% of water abstraction agriculture is the most significant user of blue water, but often regionally competes with other uses. Therefore, the proposed project focuses on the Water-Food-Energy Nexus.
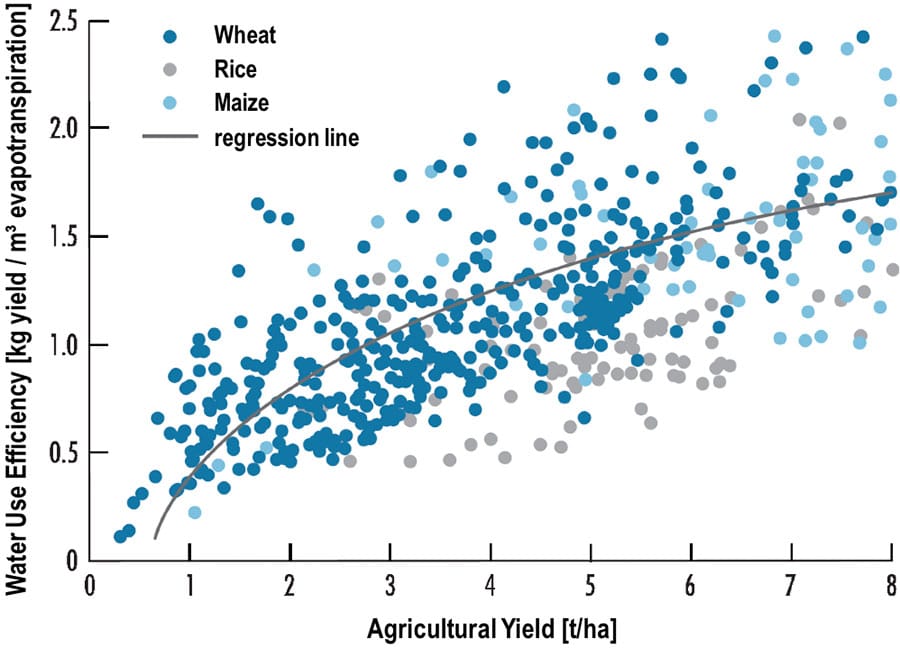
Fig.4: Water use efficiency as function of agricultural yield for three important global crops. Increases in yield are functionally connected with higher water use efficiency (adapted from Zwart and Bastiannsen 2004).
Limited water resources give the sustainable increase in water use efficiency the central role in securing a growing demand for water-related goods such as food. The rapidly increasing global trade of agricultural products generates global virtual water flows whose size is statistically well documented. On the level of aggregation used in current research work, however, only rough statements about the water use efficiency and scarcity of the used water resources are possible. They are also possibly subject to large errors. At this level of aggregation the virtual water that is implicitly traded with agricultural commodities forgets about the scarcity, efficiency and sustainability with which it was used during production at the source of the commodity. Scarcity, efficiency and sustainability in water use show very high spatial and temporal variability. Thus, these parameters change substantially in much of the world as along arbitrary transects of river courses to their hinterland. While water is abundantly available along the rivers usually water scarcity and overexploitation as of groundwater resources prevails only a few kilometers inland. This situation of tension between local production and global trade of agricultural commodities together with inherent non-linearities as shown in Fig.4 describes a classic scale problem. The sole global, large-scale collection and analysis of the conditions based on statistics is insufficient to connect new management options for sustainable and efficient water use at local and regional level with strategies for global trade in virtual water and thus to achieve progress in water-related SDGs which can be documented in a transparent, resilient and independently verifiable manner.
High-resolution monitoring system for water-related SDGs
So far missing is therefore a timely, spatially explicit, high-resolution global coverage of virtual and real water flows in terms of quantity, efficiency, scarcity and sustainability of the managed water resources in order to determine and assess the local and regional water use, especially in crop production and for virtual water trade.
The implementation of the European satellite fleet COPERNICUS opens up new possibilities of Earth observation from space, which allow observing the growth pattern of plants in agricultural areas with high temporal resolution and at plot-level. Weather and farming-practices (fertilization, irrigation, pest control) lead to different growth curves that are associated with different yields, water consumption and water use efficiencies (Fig.4). The observation time series of COPERNICUS satellites contains, at least in principle, information about the management intensity and the underlying water use efficiencies for green and blue water. To be able to extract these information Earth observation alone are not conclusive. For this purpose, the impact of climate and weather on the development of the crops must be separated from the impact of the farming practices. Plant growth models that make crops grow under given weather conditions with a wide range of different farming practices allow this separation. From an ensemble covering a variety of cultures and agricultural practices, the member of the simulation set that best fits the satellite observation time series is selected (see Figure 2). It optimally represents the actual agricultural practices at the site and is linked to a specific simulated yield and a specific simulated water use efficiency. This allows obtaining large coverage and high resolution information on current yields, water use efficiency and water scarcity in a timely manner. It can be operationalized based on the freely available COPERNICUS satellite data streams. This approach has already been successfully applied by project partner VISTA in different parts of the world in the context of pilot projects and is a key component of the global monitoring concept of the project (Hank et al. (2015)).
To implement this approach complex, numerically expensive models have to be driven globally with downscaled weather data at high temporal (1h) and spatial (1km) resolution and large amounts of satellite data has to be processed automatically. For this we rely on the massive computing power of today’s high performance computing (HPC) resources and expertise in the use, archiving and displaying of large amounts of data. The ensemble data on crop growth resulting from the simulations, which contains local, detailed information on the potentials of different farming practices and related water-use efficiency will be made freely accessible. They contain local, detailed information on the potential of different agricultural practices and the associated possibility of improving water use.
The lessons learnt during the implementation of the monitoring approach are used to develop the concepts of a future operationalization of an automated remote-sensing based approach to global monitoring of water-related SDGs. In the course of an expected further rapid development in computer and data handling resources in the near future it can be foreseen that the developed monitoring concept can be implemented, with proper adaption, in data centers of e.g. FAO or UNEP or as a cloud-based solution through commercial suppliers.
The monitoring data is used in ViWA to analyze in detail the ecological, agricultural and societal water flows in representative globally distributed watersheds in order to study the competition for water among the different sectors (domestic and industrial use, ecosystems, agriculture and irrigation) and the sustainability of water use in terms of groundwater and surface water extraction including the effects on ecosystem services. Evapotranspiration, lateral flows and groundwater recharge rates for managed and natural ecosystems, near-surface groundwater flow and base flow as well as water use efficiency and yields are simulated using a model compound to generate river flows in selected, globally distributed basins of different sizes (A = 10⁴ to 10⁷ km²). The reference watersheds (to be selected) also form the basis for a detailed local-to-global economic analysis of the virtual water flows, which includes the available information on quantity, efficiency, scarcity and sustainability of the managed water resources. The corresponding upscaling concept is shown in Fig.5.:
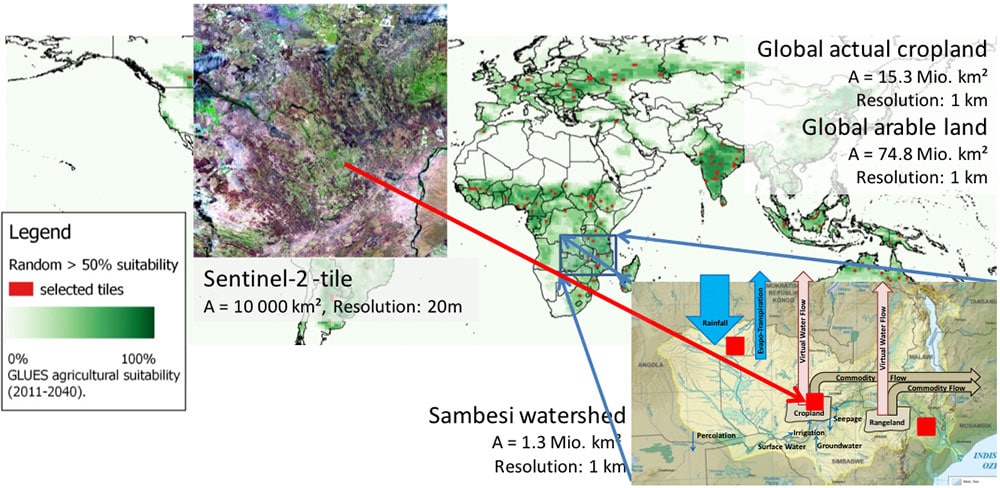
Fig.5: The ViWa scaling concept exemplified with the Sambesi basin: Global agricultural suitability (in green (Zabel 2014)) forms the basis for the high resolution global ensemble simulations (Fig.2). At the same time Sentinel-time series (20m, every 10 days) are analyzed at 150 global sampl Sentinel-2-tiles of 10 000 km² each (red squares) to select ensemble members which represent satellite observations of plant growth. Large sample watersheds around the Globe are selected (e.g. Sambesi) and simulated in detil using coupled surface-groundwater models to determine water balance and water conflicts between agriculture, ecosystem services and human water supply. The local and regional results are scaled up to the global arable land and used for the simulation of global virtual water flows and global food trade.